
Relative and absolute humidity
Relative and absolute humidity with HX, IX and Mollier diagram
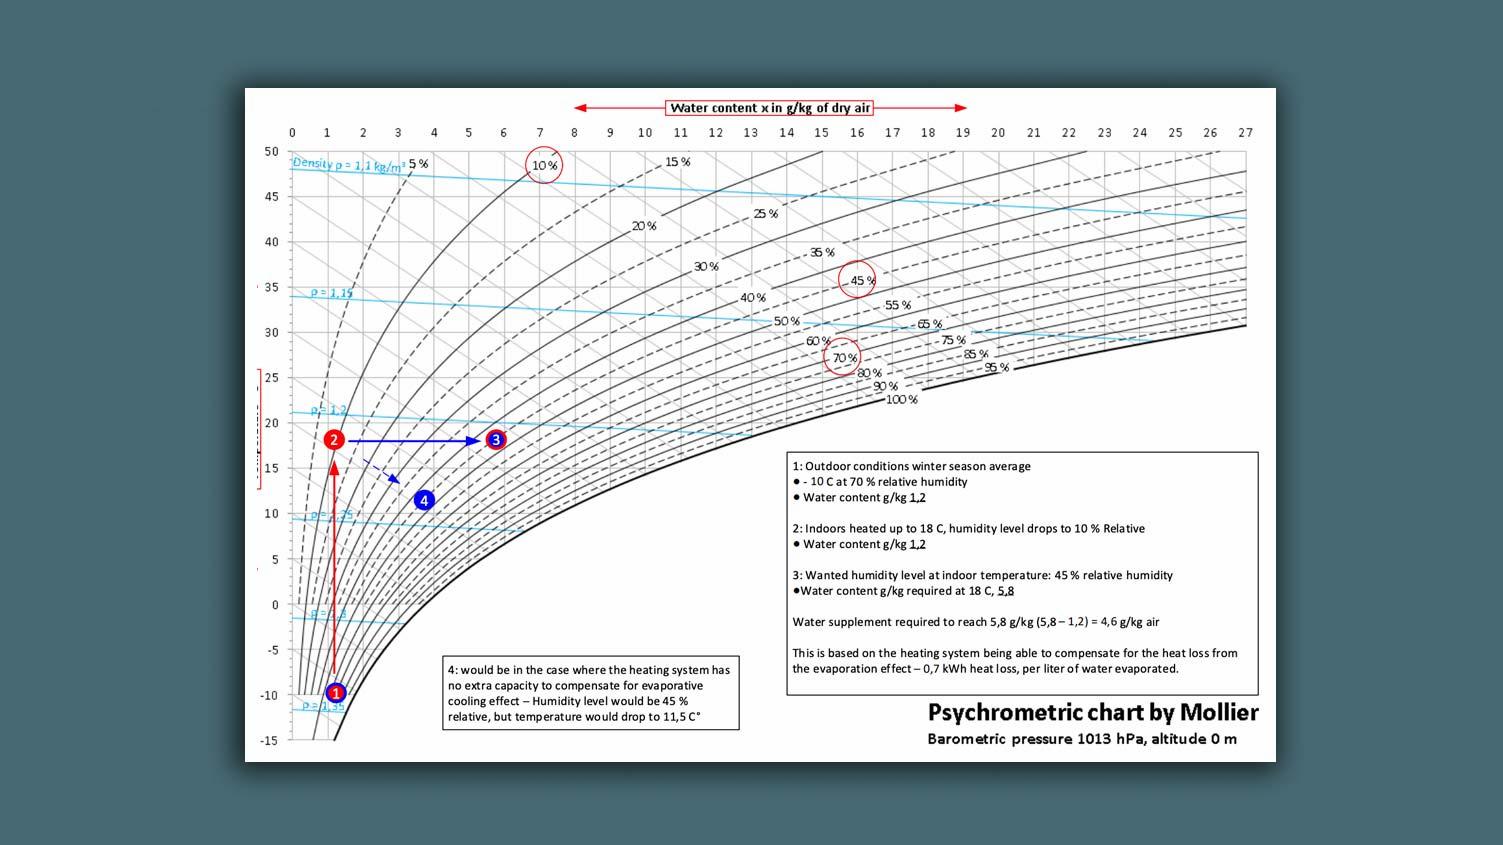
The IX/HX or psychrometric diagram (the Mollier diagram) is one of the most useful tools when designing an air humidifying system.
The Mollier diagram is used to calculate the amount of water one needs to add in order to obtain a desired cooling effect or a desired humidity level in a room.
Example of how to use the Mollier diagram
Step 1
In this example, we are looking at winter conditions: -10° C, 70% relative humidity (RH).
Using the diagram, we can read that the water content at these conditions is 1.2 g/kg (water/air)
Step 2
Indoor conditions are set at 20° C, achieved by heating.
At this temperature, the curved graph shows that the humidity level indoors drops below10% relative air humidity.
Step 3
We wish to reach 45% relative humidity.
We can now read in the diagram that the water content required is 5.8 g/kg (water/air).
This means we need to add 4.6 g/kg (as we already have 1.2 g/kg).
Adiabatic cooling effect
But - since we also have the adiabatic effect, the addition of this amount of water will cause a cooling effect in the room – the temperature will drop from 20° C to app. 13° C (step 4). As a rule, 1 liter of evaporated water will have a cooling effect of 700 W.
If we want to maintain the current room temperature, more heat must be added to compensate for this evaporative cooling effect.